Hotel Industry Trend

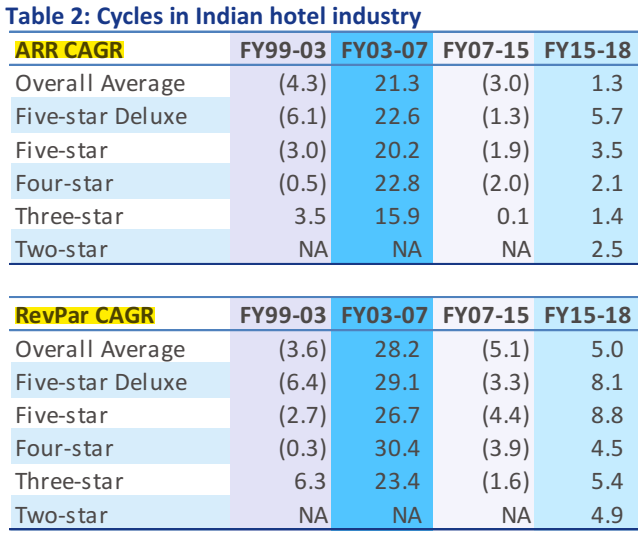
Cycles in Indian Hotel Industry

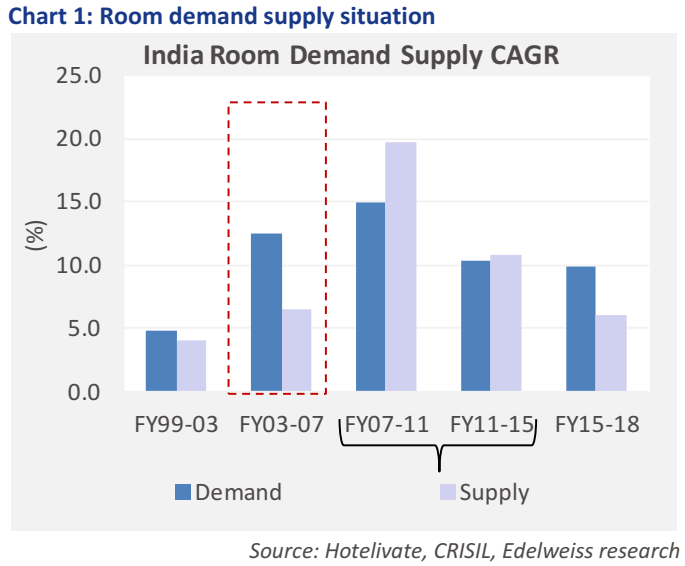
Room Demand vs Supply CAGR

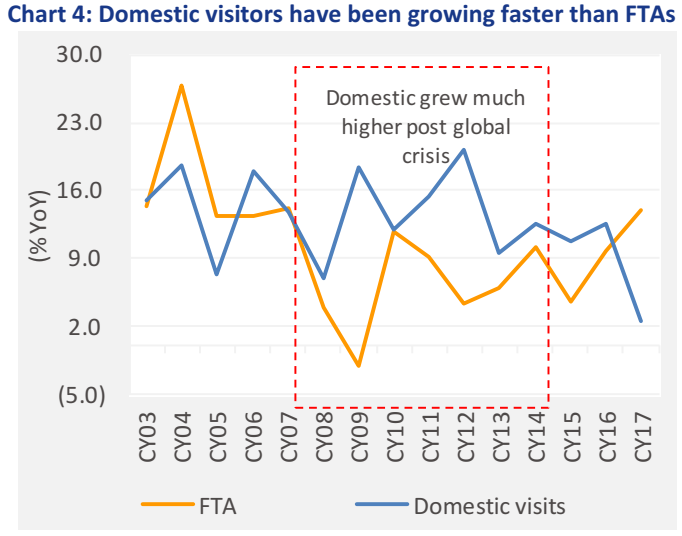
Domestic Tourists vs Foreign Tourist Arrivals

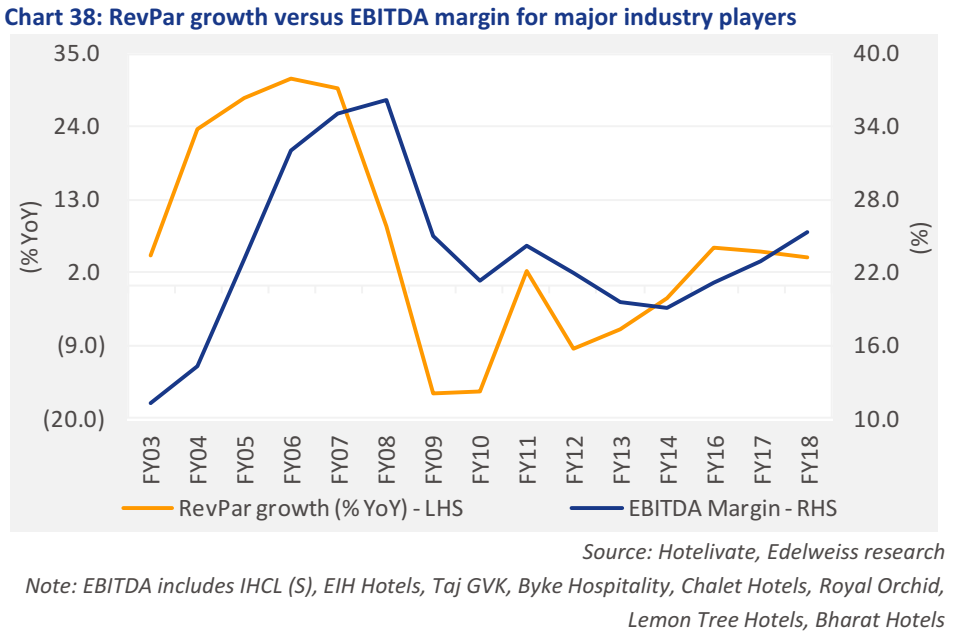
RevPar Growth vs Ebitda Margin
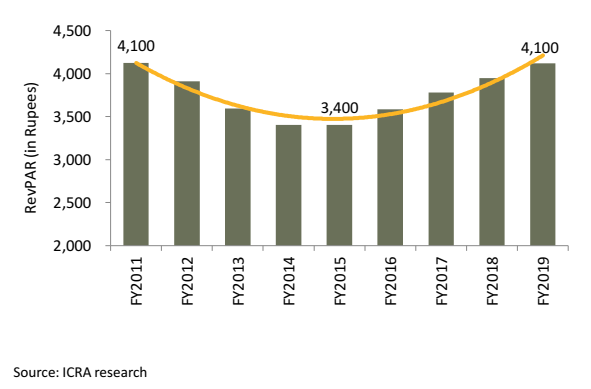
RevPAR Trend -

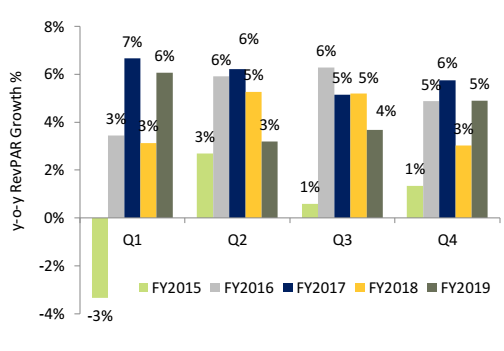
YoY RevPAR Growth Trend -

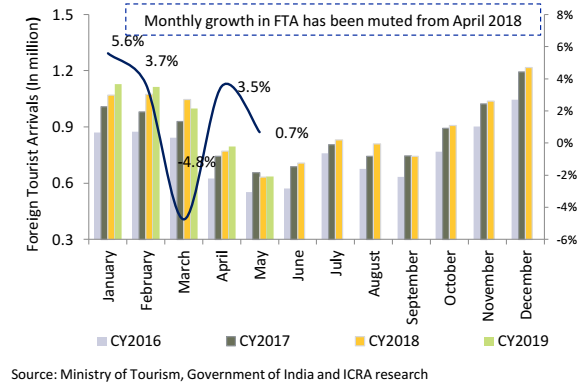
Foreign Tourist Arrivals in India -

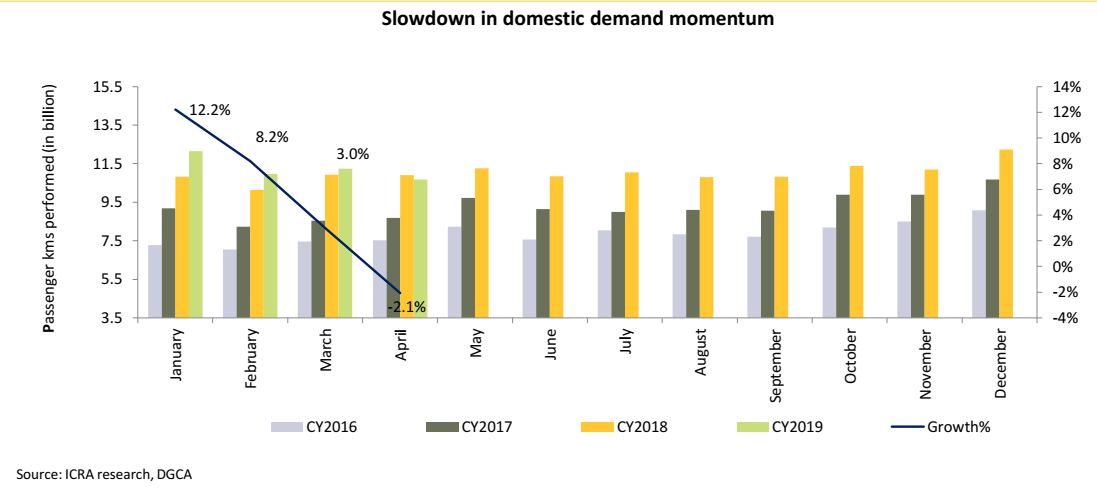
Domestic Demand Momentum

Aggregate Revenue Growth Trends

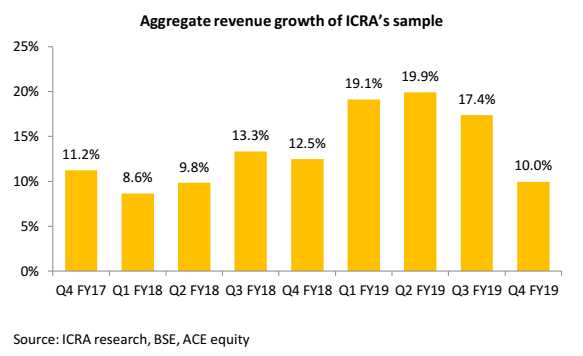
Quarterly Revenue Trend

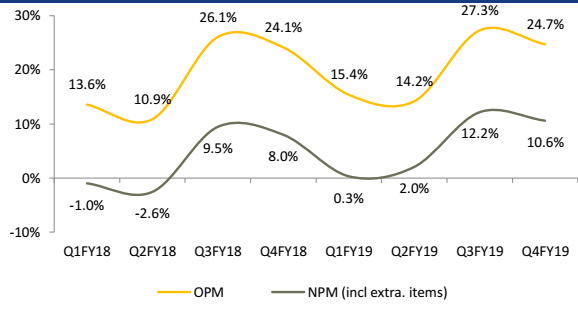
Quarterly OPM and NPM Trend
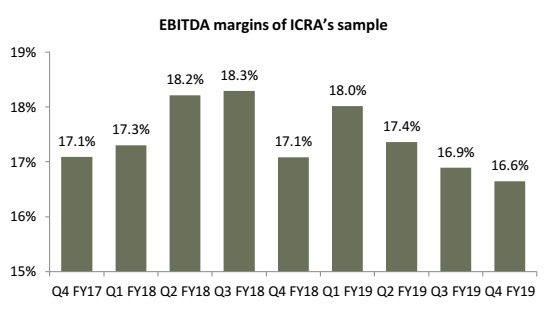
Ebitda Margins

Supply vs Demand of Rooms Projections


Data Source 1  : Edelweiss Research

Data Source 2 : ICRA

Interesting Charts from Brokerage Reports

Broking Houses : Active Customer Base

Source : HDFC Securities

image

Broking Houses : Volume Market Share

Source : HDFC Securities

image

Cement Prices : M-o-M  Change in (%)

Source : Reliance Securities

image

Cements : Segments Driving Demand

Source : Trust Group

image

Cement : Capacity Chart

Soure : Trust Group

image

Residential Property : Prices of Key Cities

Source : Kotak Institutional Equities

image

Interesting Charts from Brokerage Reports

How HSAW, DI and PVC Pipes are used in Water Transportation

Source : Narnolia

Mode of Logistics Transportation in India

Source : Dalal and Broacha

Market Share of Lubricants Players

Source : Yes Securities

Home Textiles - Companies presence across Value Chain

Source : JM Financial

Welspun, Trident and GHCL are fully integrated players, Indo Count
and Himatsingka are partially integrated

Airline Fleet Strength

Source : Stewart and Mackertich

Per capita cement consumption across world

Source : SKP Research

Interesting Charts from Brokerage Reports

Expectation of strong earnings recovery in midcaps

(Source : Elara Securities)


FII and DII proportion to Free Float

(Source : Motilal Oswal)


% of BSE 200 stocks trading above 200 DMA

(Source : Goldman Sachs)


India's allocation in EM and AEJ Mutual Funds

(Source : Goldman Sachs)


Gap between 200 DMA and 50 DMA | Realized inter day volatility

(Source : Morgan Stanley)


Difference of Nifty 50 and Midcap 100 rolling returns (%)

(Source : Motilal Oswal)


There has been no two consecutive years of negative returns in midcaps

(Source : Elara Securities)


In past 5 out of 6 elections, nifty has averaged 13% returns in 3 months before election results

(Source : Goldman Sachs)


Nifty and Nifty midcap 100 - Ownership structure

(Source : Motilal Oswal)


Nifty Midcap 100 Total market cap at five year low

(Source : Motilal Oswal)